1. INTRODUCTION
Acacia gum is a dried, hard, nodular exudate of about 10 – 50 mm in diameter obtained under stress conditions from the stems and branches of Acacia senegal (L.) Willdenow or Acacia seyal (fam. Leguminosae) [1, 2]. Sudan has traditionally been the main acacia gum producer (mainly Acacia senegal) while Chad and Nigeria produce mainly Acacia seyal [3]. Nigerian gum Arabic is sorted out into grade 1 (Acacia senegal), grade 2 (Acacia seyal) and grade 3 (Combretum and Albizia) [4, 5]. In 1998, Acacia seyal was certified by the Codex Alimentarious Commission of Food and Agriculture Organization (FAO), to have the same status with Acacia senegal in food and Pharmaceutical applications thus, the need for Nigeria to tap into this and upgrade her status in the world acacia gum market. Being a natural polymer, Acacia seyal gum can be used as a pharmaceutical excipient in tablet formulation. An excipient is a natural or synthetic substance formulated alongside the active ingredient of a medication, included for the purpose of bulking-up formulations that contain potent active ingredients or to confer a therapeutic enhancement on the active ingredient in the final dosage form, such as facilitating drug absorption, solubility or delivery [6].
Drug modification involves altering the release profile, site of absorption or the rate of absorption of the drug in plasma in order to either reduce the frequency of drug administration, improve patient compliance and/or to reduce the side effects of the drug [7]. One of the numerous methods of modifying natural polymers to obtain suitable materials for drug delivery systems is cross-linking, which involves re-enforcing bonds with chemical bridges between molecules or polymer chains. A cross-link is a bond that links one polymer chain to another, which could be covalent or ionic. In the ionic gelation technique of cross-linking, the cross-linking agent induces an interaction between the ionic or functional moiety and the polymer chain, leading to the formation of a more strongly bonded molecular chain network [8, 9]. Cross-linking affects the physical characteristics of polymers to include particle properties, hydration and water sorption capacities as a few of such properties which may lead to the cross-linked gum becoming more resistant to high temperatures, high shear and an improved viscosity [9]. Considering the advantages of the improvement of some of these physicochemical properties, the cross-linked gum thus formed may be applied in the food and Pharmaceutical industries for its gelling ability and can also serve as a suitable matrix for the formulation of sustained-release tablet formulations. This study aims at preparing Acacia seyal gum cross-links using calcium chloride as the cross-linking agent and evaluating some organoleptic and physicochemical properties of the cross-links formed in comparison to the purified natural Acacia seyal gum, for wider application in the Pharmaceutical industry.
2. MATERIALS AND METHODS
Sample Collection/ Identification
The crude acacia gum exudates (grade 2) was collected from Gombe State, Nigeria and taken to the Herbarium section of the Department of Biological Sciences, Ahmadu Bello University, Zaria for identification and given a voucher number.
Extraction and Purification
The method used by Abdulsamad et al. (2012) was adapted. Five hundred grams (500 g) of the Acacia seyal gum exudates was weighed and dissolved by stirring in 1.5 L of distilled water contained in a 3 L beaker. The mucilage formed was then filtered using suction through a fine muslin cloth to remove any extraneous matter. One (1) liter of acetone was gradually added into the beaker containing the mucilage while stirring and as the gum started precipitating, further additions of the acetone led to the gum becoming more solid. The mixture was decanted and 500 ml acetone was added gradually onto the slimy gum while squeezing out the remaining water entrapped using hands protected with hand gloves until the gum started to crumble and eventually got finely dispersed in the acetone, signifying the near exhaustive separation of the gum from the water. The gum was then separated from the acetone by filtration, spread on non-stick baking trays and dried in an oven (Galenkamp, Germany) at 40 ° C for 5 h [10]. The gum was then removed from the oven and dried at room temperature overnight. This was then blended in a laboratory blender for 30 s and weighed. The powder so obtained was then transferred to a screw-capped glass container, labelled as ‘EG’ and stored for future use.
The extraction yield (%) was calculated using the relationship:
% Yield = (W2 / W1) x 100 ——— (1)
Where W1 is the weight of the Acacia seyal gum exudates used for the purification, W2 is the weight of the dried Acacia seyal gum purified.
Cross-linking of the Purified Acacia seyal gum (EG) Using Calcium Chloride
The ionic gelation method used to cross-link Acacia senegal by Mbah et al. (2012) was adapted for this process. One hundred grams (100 g) of the purified Acacia seyal gum (EG) powder was dispersed properly in two (2) liters of distilled water in a beaker. This was then divided equally into four separate 500 ml conical flasks and shaken for 24 h using a mechanical flask shaker (Gallenkamp, England). After shaking, the contents of the four flasks were then transferred into a plastic container and one (1) liter of freshly prepared 1M calcium chloride solution was added gently with intermittent stirring. This solution was divided into six different 500 ml conical flasks and then shaken for 6 h then transferred into a clean plastic container and allowed to stand for another 6 h. The hydrated gum particles were precipitated by washing serially with cold acetone to remove any residual water and filtered using a clean muslin cloth. The harvested gum was dried on a non-stick tray in an oven at 40 ° C for 5 h and then air dried at room temperature overnight.
This was then blended in a laboratory blender for 30 s and weighed. The powder was then transferred into a screw-capped container, labelled as ‘CG’ and stored for future use.
The cross-linked gum yield with reference to the initial starting material was calculated using equation (2) below and recorded accordingly.
% Yield = (W2 / W1) x 100 ——— (2)
Where W1 is the weight of the crude Acacia seyal gum used for the purification process (500 g) and W2 is the weight of the cross-linked Acacia seyal gum powder (CG) obtained.
Differential Scanning Calorimetry (DSC)
Heat flux differential scanning calorimeter (NETZSCH-Geratebau, Germany) was used to obtain valuable information on the cross-link formation between the gum and the calcium chloride. Samples (10 mg) of the purified Acacia seyal gum (EG) and the cross-linked Acacia seyal gum (CG) were respectively encapsulated in aluminium disposable pans. DSC scans were ran to measure the energy changes associated with heating the samples upto 300 ° C at a scan rate of 10 ° C/min for a total of 25 min, using nitrogen as purge gas. Differences in the thermograms of the two polymers was then noted. Appearance or disappearance of peak(s) suggests the formation of new bonds/structures [11].
Fourier Transform Infra Red (FT-IR) studies
FT-IR spectra of purified Acacia seyal gum powder (EG) and cross-linked Acacia seyal gum powder (CG) were obtained using JASCO IR spectrophotometer (model 4200, Jasco Inc. Japan). The powdered samples were mixed with potassium bromide (KBr), compressed into pellets and analysed between 400 and 4000 cm-1. The spectra of EG and that of CG were then compared to reveal the presence or absence of IR absorption bands representative of the respective functional groups of interest. Appearance, disappearance or broadening of absorption band(s) on the spectra of CG in comparison with that of EG was used to assess the crosslinking of the purified Acacia seyal gum powder (EG) [12, 13].
Organoleptic Characterization
The polymers (EG and CG) were observed for their colour, texture, taste and odour using the sense organs.
Physicochemical Characterization
Moisture Loss on Drying (MLD)
The method described by Abdulsamad et al. (2012) was adopted [10]. Two (2) g of the polymer was weighed (W1) and dispersed into three tarred and conditioned evaporating dishes. The dishes were conditioned by heating at 105 ° C for 30 min followed by cooling in a desiccator for 30 min. The samples were heated at 105 ° C for 2 h, cooled in a desiccator for 30 min and weighed. The samples were heated again for another 2 h and cooled for 30 min in a desiccator then weighed (W2). The MLD was then determined.
% MLD = (W1 – W2) 100 / W1 ——— (3)
Where W1 and W2 are weights of the samples before and after drying, respectively.
Determination of Solubility of the Polymers
Two hundred (200) mg each of EG and CG were weighed and respectively dispersed in 10 ml each of some solvents contained in test tubes. Non-polar solvents (diethyl ether and toluene), polar aprotic solvents (ethyl acetate and dimethylsulfoxide (DMSO) and polar protic solvents (isopropanol and water) were used as solvents. At ambient temperature, the tubes were shaken using flask shaker for 10 min, allowed to stand for 10 min and visually observed for the ability to go into solution [14].
Aqueous solubility of EG and CG was determined quantitatively in distilled water (30 ° C). A 1 g quantity of the gum was added to 10 ml of distilled water and left overnight. The clear supernatants (5 ml) were taken and placed in small pre-weighed evaporating dishes and heated to dryness over a digital thermostatic water bath. The weights of the dried residue with reference to the volume of the solutions were determined and recorded [15].
Viscosity Determination
The viscosity of a 2 % aqueous dispersion of the polymer was determined using an Ostwald viscometer, clamped vertically in a beaker of water at room temperature and allowed to equilibrate. The time taken for the solution to flow through the marked points of the Ostwald viscometer was then recorded. The average time in seconds (s) was determined. The test was first conducted using water as the fluid and the time of flow determined. Using the equation below, the kinematic viscosity was then calculated.
ηg = ηw ( tg / tw) ——— (4)
where ηg = dynamic viscosity of the gum; ηw = dynamic viscosity of water at 30 ° C = 798 m–2; tg = time (s) for the gum dispersion to flow through the Ostwald viscometer; tw = time (s) for water to flow through the Ostwald viscometer.
Swelling Ratio/ Rate Determination
A 1 g sample of the polymer was weighed and transferred into a clean 10 ml measuring cylinder. The volume occupied by the polymer was then recorded. Distilled water was added up to the 10 ml mark and the cylinder allowed to stand for 24 h and the new volume occupied by the swollen polymer recorded. The swelling property of the polymer observed within 24 h was expressed both as the swelling ratio and swelling rate. The swelling ratio (Qd ) for the polymer was calculated from the equation below [16]. The swelling rate was calculated as the volume increase: Vd – Vs per h.
Qd = ( Vs – Vd ) / Vd ——— (5)
Where Vd and Vs =volume of dry polymer and volume of swollen polymer, respectively.
Hydration capacity (HC)
The method used by Olorunsola et al. (2016) [17] was modified and used for the determination of the hydration capacity. The samples EG and CG (1 g each) were dispersed seperately in 10 ml distilled water in a preweighed centrifuge tube. This was then mixed by stirring for 2 min, stoppered and centrifuged for 5 min. The supernatant was decanted, leaving the sediments. The tubes were then placed in a forced-draft air oven (Galenkamp, Germany) at an angle of 15 – 20 º, allowed to dry at 50 ° C for 25 min, cooled in a desiccator for 25 min and then weighed to obtain the weight of the sediment, W2 [14]. The hydration capacity (H.C) was calculated thus.
HC = ( W2 / W1 ) ——— (6)
Where W1 = initial weight of dry polymer and; W2= weight of the sediment.
pH Determination
Dispersions (1 % w/v) of the samples were prepared and their pH measured using a microprocessor pH meter (Hanna Instruments, pH 213, Romania) after standardization with standard buffer solutions (pH 4.0, 7.0 and 9.2 respectively). The procedure was performed three times per sample and the mean calculated [9].
Moisture Sorption Profile
The sample (1 g) was spread evenly over the surface of a 0.70 mm tarred aluminium dish. Samples were placed in a desiccator containing deionised water in its reservoir to mimic a relative humidity of 100 %, at room temperature. Over a period of 5 days, at regular intervals of 24 h, the weight gained by the exposed sample was recorded and the amount of moisture absorbed was calculated from the weight difference [9].
Moisture Uptake = ( Me / Md ) x 100 % ——— (7)
Where Me= amount of moisture absorbed and; Md= weight of the dry powder
Particle Size Distribution
Sieves of different sizes were washed, allowed to dry and arranged such that 500 µm was on top, followed by 250 µm, 150 µm, 90 µm, 75 µm and finally 45 µm. The powder sample (50 g) was then weighed and placed on the uppermost sieve (500 µm) and the cover placed over it. The stack of sieves were then placed on the laboratory sieve shaker (Endocotts Limited, London, UK) and set into vibration for 10 min. The powder particles retained on each sieve were collected separately and then weighed.
Bulk density
The sample (50 g) was weighed and transferred into a 100 ml plastic measuring cylinder. The volume occupied was recorded and the bulk density calculated. The procedure was carried out three times and the mean calculated.
Bulk density (g/cm3) = weight / volume ——— (8)
Tapped Density
The sample (50 g) was weighed and transferred into a 100ml plastic measuring cylinder using a glass funnel. The cylinder was then dropped continuosly from a 2 cm height onto the work bench until constant volume was attained (200 taps). The volume attained was noted and the tapped density calculated. The procedure was carried out three times and the mean calculated.
Tapped density (g/cm3) = weight / final volume ——— (9)
True Density (Dt)
The fluid displacement method was used for determination of the true density of the samples according to Mbah et al. (2012) [9]. A density bottle was washed, dried thoroughly in an oven and weighed. The density bottle was filled with xylene as the displacement fluid and weighed. A 1 g quantity of the sample was weighed and transfered into the xylene-containing bottle and then weighed. The true density, Dt was calculated thus:
Where W=weight of the sample; a=weight of density bottle + xylene; b=weight of density bottle + xylene + sample; SG=specific gravity of xylene (0.863).
Particle Flow Properties
The static angle of repose was measured according to the fixed funnel and free standing cone method [18]. A 50 g quantity of sample was carefully poured into a stoppered glass funnel, clamped 10 cm above a flat surface using a retort stand. The stopper was then removed and the time taken for the powdered sample to flow through, forming a cone, was recorded. The mean diameter and the height of the powder cone formed were measured. The internal angle of repose was calculated using equation 11, while the flow rate was calculated as grams per second. This was repeated thrice and the mean calculated.
Angle of repose = tan A = 2h / D ——— (11)
Where h = height of the powder cone; D = diameter of base of the powder cone.
The compressibility indices and Hausner’s ratios of samples EG and CG were determined with the data obtained from the bulk and tapped densities, using equations 12 and 13.
Compressibility (%) =[ ( Tapped density – Bulk density) / Tapped density ] x 100 ——— (12)
Hausner’s Ratio = Tapped density / Bulk density ——— (13)
RESULTS AND DISCUSSIONS
Sample Collection and Identification
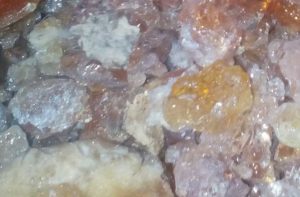
The crude Acacia seyal gum exudates (fig.1) was collected from Gombe State, Nigeria. It was identified as Acacia seyal, Family Leguminosae and given the voucher number 900248 at the Department of Biological Sciences, Ahmadu Bello University Zaria, Nigeria.
Click to view
Extraction (Purification) and crosslinking Yield
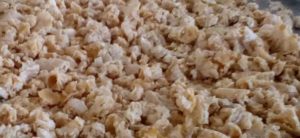
The percentage extraction yield of the purified Acacia seyal gum (EG) was calculated to be 60 %. The picture of the extracted and purified acacia gum flakes is shown in fig. 2.
Click to view
Natural biopolymers from plant sources contain many impurities (e.g., fat, protein, fiber, natural pigment and endogenous enzymes), therefore, an efficient purification process is recommended to minimize these impurities and consequently improve the functional properties of the biopolymer [19]. The extraction yield of 60 % obtained on purification of the crude Acacia seyal gum can be justified as the presence of impurities in the crude exudates could add to the weight of the sample. The extraction and purification process is expected to have lowered or removed these impurities considerably so that the weight of the gum recovered was reduced. A yield of 48 % with reference to the crude exudates, obtained after cross-linking EG with calcium chloride is most likely associated with the quality of the extraction process. There is however possibility that both yields could have been affected by loss of materials due to the difficulty in totally recovering the gum from the sieve cloth and/or due to spillage but, these were considerably taken care of by adhering to precautions. The purification yield value was higher than the purification yield reported for fenugreek gum (22 %) [20], locust bean gum (26.66 % to 33.16 %) [21] and within the range reported for guar gum (22 % to 78 %) [22] and for durian seed gum (30.9 % to 72.4 %) depending on the purification method [19]. The crosslink yield (48 %), was lower than the value reported for crosskinked high amylose starch (95 %) [23]. Generally, the more processing procedures or steps, the more the chances that the yield is expected to reduce. The quality of the acetone used as precipitating agent, the time of exposure to the precipitating agent and the method used may also have affected the yields obtained [22, 19, 10].
Thermal Analysis Using Differential Scanning Calorimetry (DSC)
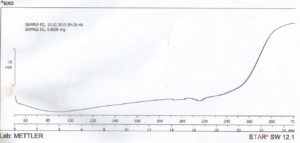
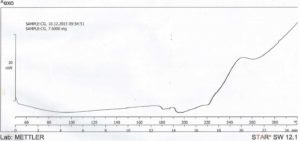
The result from DSC studies, figures 3 and 4, revealed that the cross-linked gum (CG) had a higher extrapolated peak of 118.10 ° C, while the extrapolated peak of EG was 49.96 ° C. The events shown between 24 and 100 ° C may be attributed to evaporation of solvent [24]. The minimum heat flow of EG is – 6.12 mW at 88.13 ° C, while the maximum had 18.65 mW at 300.41 ° C. CG on the other hand had a higher minimum heat flow of – 3.48 mW at 197.67 ° C and a maximum of 10.09 mW at 300.59 ° C. The two samples showed similarities in degradation temperature because of their insignificant difference, 300.41 ° C and 300.59 ° C for EG and CG respectively, that fall within the maximum degradation temperature range of 270 – 320 ° C determined for polysaccharides by Silva (2006) [24]. This shows that, and as the name connotes, cross-linking did not tamper with the structural framework of the CG but simply linked strands of the polymer. The appearance of a new peak at about 240 – 250 ° C at about 20 min into the scanning process on the thermogram of CG, which was initially absent on the thermogram of EG is an important event to note as the appearance or disappearance of peak(s) suggests the formation of new bonds or structures [11]. The modification of the gum may have led to these changes in the heat thermogram of CG, suggesting that it may be as a result of a stronger bond between molecules of the polymer chain. Abdulsamad et al. (2014) observed that cross-linking of cashew gum with epichlorohydrin led to the slight increase in the degradation temperature and opined that this may be as a result of the presence of “impurities” which are most likely the cross-linking agent. The appearance and disappearance of a peak may also be used to denote modification in structure of compounds, as a result of addition or removal of some groups. This also goes to show that CG has a higher degree of stability in the presence of heat than EG.
Click to view
Click to view
Fourier Transform Infra-Red (FT-IR) Studies
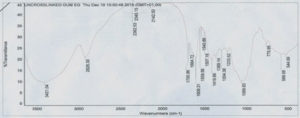
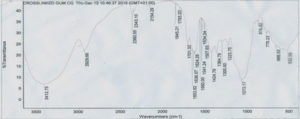
A Fourier transform infra-red (FT-IR) spectrum involves an observation of the vibrational patterns of molecules as this is considered to be a unique physical property and is characteristic of the molecule [13]. Generally as shown in figures 5 and 6, there was retention of some bands in the polymer backbone as shown by hydrogen bonding, which has a significant influence on the peak shape and intensity, causing the broadening of the peak as it ranges between 3500 – 2400 cm-1 [12]. There was retention of the bands at positions 2928.30, which indicates C–H (Methylene) stretching and at position 1609.30, which indicates –C=C – stretch. On the spectra of CG, the appearance of bands at positions 1845 and 1793 cm–1 which are within the group frequency suggestive of carbonyl compounds and 878 cm–1, which is within the group frequency assigned for C=O stretch for oxy compounds may be indicative of a change caused by the cross-linking process. Finally, the 668.53 cm–1 band of CG replaced the 599.58 cm–1 absorption band of EG. This may be an indication of a replacement reaction due to the crosslinking agent as generally, peak values < 667 cm–1 indicate the presence of iodide or bromide ions, while values between 800 – 600 cm–1 are indicative of chloride ions [13]. These may serve as a pointer that the cross-linking has taken place as appearance, disappearance or broadening of absorption band(s) on the spectra of CG in comparison with that of EG was used to assess the crosslinking of the purified gum.
Click to view
Click to view
Organoleptic and Physicochemical Characterizations
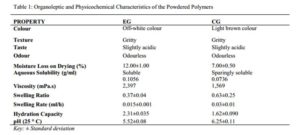
From the results shown in Table 1, sample EG had an off-white colouration but on cross-linking, CG showed a darker colouration which was brownish although, both were gritty in texture. This change in colour intensity is most likely as a result of the addition of new substances introduced by the cross-linking process or as a result of the drying process, which may have denatured some of the surface polymers. The slightly acidic taste of EG and CG implies that the polymers may be used in tableting without the need for sweetening agent. Both gums being odourless implies that there is no need to add flavourants to the tablet formulation and this justify their use in tableting, as patients prefer medicines that are either odourless or of a nice fruity aroma.
The moisture loss on drying (%) gives a quantitative view of the amount of volatile matter of any kind that is driven off under any specified condition [25]. The moisture loss on drying was found to be 12.00±1 % and 7.00±0.5 % for EG and CG respectively. This shows that EG has a fairly higher moisture content than CG and this result is similar to the report by Mbah et al. (2012), who reported a moisture content of 14.00±1.32 % for the natural acacia (Acacia senegal) polymer and 5.00±0.90 % for its cross-linked derivative. In an evaluation of cashew gum cross-linked with citric acid by Abdulsamad et al. (2015), a loss on drying (%) of 8.47 for the crude gum and 7.21 for the cross-linked gum was reported. The result reported in this study therefore showed a similar pattern of moisture loss on drying (MLD %), with the cross-linked gum having a lower moisture content compared to the purified gum. According to Kibbe (2009), official recommendations specify that MLD of acacia should be ≤ 15 % and the values obtained in this study falls within this recommended limit [26]. As such, CG might be less prone to microbial contaminations because of its lower moisture content. The ability of the two polymers to go into solution in various solvents selected based on polarity showed that they were both insoluble in all other solvents (diethyl ether, DMF sulfoxide, toluene, ethyl acetate, isopropanol and ethanol) except in water (30 ° C) as shown in Table 1, which was able to dissolve EG and form a soluble solution (0.1056 g/ml) while CG formed a very cloudy dispersion described as sparingly soluble (0.0736 g/ml). This agreed with results obtained based on visual observation by Abdulsamad et al. (2014), when cashew gum was cross-linked with epichlorohydrin [14]. The reduced solubility of CG in water when compared to EG could be as a result of the presence of certain ions such as calcium, which when present in large amount causes aqueous insolubilities of gums [27]. It can thus be said that cross-linking reduces solubility or even renders a soluble material insoluble [28]. This also buttresses the fact that the polymers are hydrophilic in nature, though the cross-linking process reduced the degree of hydrophilicity.
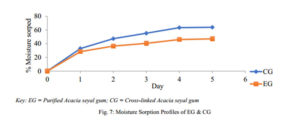
The kinematic viscosity shown in Table 1, as obtained using an Ostwald viscometer showed that CG has lower viscosity (1,569 m.Pas) compared to EG (2,397 m.Pas). It can be said that because of the insolubility of CG, it did not have the capacity to form a smooth gel and as such this may have led to the lower viscosity observed when compared to EG which was able to fully go into solution, forming a gel that is able to cause the increase in the bulk viscosity. According to Alderborn (2007), bulk viscosity is not a good test for the functionality of true gels as a type of hydrophilic matrix system and does not generally correlate well with diffusion thus, justifying the application of CG in sustained release tableting [29]. Swelling, described as the increase in weight, volume or length has an important place in defining the performance of a polymeric material with regards to solute diffusion in drug delivery. Hydrophilic cross-linked polymers owing to their swelling capacity have found use as swellable matrices, superdisintegrants and swelling devices in drug delivery [14]. The purified gum even though it absorbed some amount of water as shown by the moisture sorption profile in figure 7 and the hydration capacity as shown in Table 1, did not swell as much as the cross-linked gum, but rather most of it went into solution because of its high solubility, and this result is similar to the report by Abdulsamad et al. (2012). Cross-linking EG caused the material to take up more liquid without going into solution, as the structural integrity of the gum was retained, thus imparting a notable swelling property on the polymer (CG) [10]. This may be because the macroporous structures of the cross-linked polymer make transfer of water molecules easier between the polymer matrix and the external aqueous phase [25]. CG can thus be employed as a disintegrant in tablet formulation studies.
Hydration capacity indicates the degree to which a material is capable of absorbing its own equivalent weight of water or how the gum retains water or how rapid water penetrates the gum [30, 15]. The hydration capacity of EG, being higher than that of CG as shown in Table 1, goes to show that CG may have become more hydrophobic due to less inter-particulate spaces arising from the bridging of the ionic moiety and the polymer chain, resulting to its insolubility and thus its inability to absorb large quantity of water. A similar pattern was reported by Moin et al. (2014), who investigated the potential of cashew gum and its cross-linked derivative in formulating sustained release delivery system using theophylline as a model drug [31]. They reported a strong degree of water uptake (hydration) by the cashew gum formulations (184.6 %), while in contrast; the cross-linked cashew gum formulations displayed a much-lowered increase (66.5 %). Determination of the water holding capacity of a hydrogel made from carbohydrate polymers for use in foods and pharmaceuticals is required to provide information on the storage and handling precautions to be adopted to avoid spoilage of the product [25].
The moisture sorption profile of a material tells of its sensitivity to moisture and its stability under humid conditions. In both polymers, the moisture sorption rose sharply on the first day but reduced as the days went by, indicating the beginning of saturation. As such, CG is expected to have the capacity to do better in humid conditions as its matrix will be retained while EG when used as a matrix may deteriorate at a faster rate and to a greater extent too. This may result in EG being affected more by microbial contaminants compared to CG and as such; CG can be applied comfortably in tableting to minimize the storage challenge that may arise in relatively humid environments.
The pH of EG (5.52±0.08) was found to be lower than that of CG (6.25±0.11), implying that the cross-linking process has reduced the acidity of EG, taking it closer towards neutrality. Generally, acacia gum is known to be naturally neutral to slightly acidic [32]. The result obtained is similar to that reported by Mbah et al. (2012), who showed a pH of 4.730±0.78 and 7.730±0.50 for natural and cross-linked acacia respectively, stating that the increase in pH may be attributed to replacement of hydrogen ion-containing moiety in the polymer chain network and this may reduce the adhesive property [9]. This neutralization of the gum by the cross-linker may also lead to the formation of a stronger ionic bond due to better inter chain hydrogen bond that reduces the electrostatic repulsion within the gum network [33].
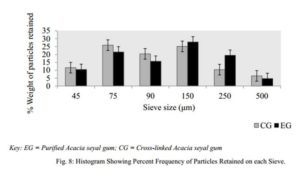
The bulk, tapped and true densities of EG being higher than those of CG imply that EG is denser than CG. The lower densities of CG may have resulted in its improved compressibility index and Hausner’s ratio. The compressibility index and Hausner’s ratio of a powder are pointers to the powder’s ability to diminish in volume and its degree of inter-particulate friction respectively [29]. It is reported that compressibility index below 16 % is indicative of good powder flowability and values above 35 % are indicative of cohesiveness while Hausner’s ratio greater than 1.25 is indicative of poor flow. For pharmaceutical powders, an angle of repose ranging between 25 ° – 45 ° is said to be satisfactory and signifies a good flow. These three parameters are considered as an indirect measurement of powder flowability. In this study, the particle size distribution, figure 8, showed EG to have more coarse particles than CG, with mean particle diameters of 149.45 µm and 139.08 µm respectively. The angle of repose (33.29±1.00 °), compressibility index (15.81±0.58 %) and Hausner’s ratio (1.19±0.01) all suggest that CG has fairly better flowability than EG and his result followed a similar pattern as reported by Mbah et al. (2012). The relatively smaller angle of repose of CG compared to EG may be attributed to the fairly better particle size distribution of CG. CG however was found to interestingly have a lower flow rate than EG even though it had better compressibility index, Hausner’s ratio and angle of repose. This however may be attributed to the presence of less coarse particles in CG compared to EG which had more coarse particles, as the smaller particles have larger surface area which may inhibit flow due to surface friction. On a general note however, both powders showed properties that were within both B.P and U.S.P recommendation of good flowability [32, 34].
Click to view

Click to view
Click to view
Click to view
4. CONCLUSION
The extracted Acacia seyal gum was effectively cross-linked with 1M CaCl2 by the ionic gelation method adapted. The results of the physiochemical parameters studied showed improvements in the hydration capacity, swelling ratio, swelling rate, densities (bulk, tapped and true), and reduced solubility in water of CG. These have helped to improve the gel forming property of Acacia seyal gum thereby, improving its release retarding property.
5. ACKNOWLEDGEMENTS
My profound gratitude goes to God Almighty; the giver of knowledge, my supervisory team from the Department of Pharmaceutics and Pharmaceutical Microbiology, Ahmadu Bello University, Zaria for their mentorship and, to the Department of Pharmaceutics and Pharmaceutical Technology, Gombe State University, Gombe, for their support.
6. CONFLICT OF INTERESTS
There are no conflicts of interest.
7. REFERENCES
- F.A.O. Non-wood foret products: gums, resins and latexes of plant origin. Annual reports. Khartoum: FAO; 1999.
- Mariana AM, Maria LB, Lorena V, Claudio DB. “Gum Arabic: More than an edible emulsifier.” Verbeek, Dr. Johan. Products and applications of biopolymers. Rome: Intechopen; 2012. p. 1-29.
- Mario J. “Commodities at a glance: Special issue on gum arabic.” United Nations Conference on Trade and Development. Ed. Nkurunziza J. New York and Geneva: United Nations; 2018. p. 2-6.
- Gary H, Ryan R. “Best Practices, Best markets.” Training the Nigerian gum arabic producer and small trader. Northern Nigeria: USAID/Nigeria; 2002. p. 1-10.
- Aghughu O, Mokwunye MUB. “Restoring Nigeria’s lead in gum arabic production: Prospects and challenges.” Report and Opinion 2010; 2(4): 7-13.
- Shalini S. “Advantages and applications of nature excipients- A review.” Asian Journal of Pharmaceutical Research 2012; 2(1): 30-39.
- Chitra SN, Rama DB, Gowthami N, Haritha M, Dhavani K, Manasa A. “Development and in-vitro evaluation of sustained release matrix tablets of salbutamol sulphate using hydrophilic and hydrophobic polymers.” Bulletin of Pharmaceutical Research 2012; 2(3): 112-117.
- Patil JS, Kamalapur MV, Marapur SC, Kadam DV. “Ionotropic Gelation and Polyelectrolyte Complexation: The Novel Techniques to Design Hydrogel Particulate Sustained, Modulated Drug Delivery System: A Review.” Digest Journal of Nanomaterials and Biostructures 2010; 5(1): 241-248.
- Mbah CC, Ogah JA, Builders PF, Kunle OO. “Some physicochemical properties of crosslinked acacia gum.” African Journal of Pharmaceutical Research and Development 2012; 4(1): 19-24.
- Abdulsamad A, Oyi AR, Isah AB, Odidi I. “Characterisation and Studies on Binding Properties of Cashew Gum and its Mixtures with Microcrystalline Cellulose in Venlafaxine Hcl Tablet Formulations.” Nigerian Journal of Pharmaceutical Sciences 2012; 11(2): 9-20.
- Saunders M. “Thermal analysis of Pharmaceuticals.” G, Gabbott. Principles and Applications of Thermal Analysis. United kingdom: Blackwell publishing 2008; 286-327.
- Hsu, CPS. “Infrared Spectroscopy.” A, Frank. Handbook of Instrumental Techniques for Analytical Chemistry. Seattle: Prentic Hall; 1997. p. 247-283.
- Coates J. “Interpretation of Infrared Spectra, A Practical Approach.” Meyers RA. Encyclopedia of Analytical Chemistry. Chichester: John Wiley & Sons Ltd; 2000. p. 10815-10837.
- Abdulsamad A, Oyi AR, Isah AB, Odidi I. “Cashew Gum Crosslinked with Epichlorohydrin to Enhance Venlafaxine Hydrochloride Release from Tablets Formulated with HPMC as Binder.” Nigerian Journal of Pharmaceutical Sciences 2014; 13(1): 43-53.
- Kipo SL, Oppong EE, Ofori-kwakye K. “Physicochemical Evaluation and Tablet Formulation Properties of Shea Tree Gum.” Asian Journal of Pharmaceutical and Clinical Research 2014; 7(5): 121-127.
- Siriporn O, Kiattisak S, Yanee P, Helmut V. “Factors influencing drug dissolution characteristic from hydrophilic polymer matrix tablet.” Scientia Pharmaceutica 2007; 1(75): 147-163.
- Olorunsola EO, Bhatia PG, Tytler BA, Adikwu MU. Hydration and swelling dynamics of some tropical hydrophilic polymers. Nigerian Journal of Pharmaceutical Sciences 2016; 15(1): 41-47.
- Etubi B, Musa AO, Olayemi OJ. Phytochemical and physicochemical studies of Vitellaria paradoxa. Nigerian Journal of Pharmaceutical Sciences 2011; 10(2): 27-33.
- . Amid BT, Mirhosseini H. Effect of different purification techniques on the characteristics of heteropolysaccharide-protein biopolymer from durian (Durio zibethinus) seed. Molecules 2012; (17): 10875-10892.
- Brummer Y, Cui SW, Wang Q. Extraction, purification and physicochemical characterization of fenugreek gum. Food Hydrocoloids 2003; (17): 229–236.
- Bouzouita N, Khaldi A, Zgoulli S, Chebil L, Chekki R, Chaabouni M. The analysis of crude and purified locust bean gum: A comparison of samples from different carob tree populations in Tunisia. Food Chemistry 2007; (101): 1508–1515.
- Cunha P, De-Paula R, Feitosa J. Purification of guar gum for biological applications. International Journal of Biology and Macromolecules 2007; (41): 324–331.
- Pawar AY, Jadhav KR, Derle DV. Cross Linked High Amylose Starch Biodegradable Implants for Sustained. International Journal of Pharmacy and Pharmaceutical Sciences 2013; 5(1): 391-397.
- Silva DA. Characterization of crosslinked cashew gum derivatives. Carbohydrate Polymers 2006; (66): 16–26.
- Abdulsamad A, Oyi AR, Isah AB, Odidi I. Derivatisation of Cashew Gum via Cross-linking with Citric Acid: Characterisation and Preliminary Citric Acid: Characterisation and Preliminary Evaluation of Tableting Properties. British Journal of Pharmaceutical Research 2015; 6(1): 22-34.
- Kibbe AH. Acacia. In: Raymond CR, Paul JS, Marian EQ, editors. Handbook of pharmaceutical excipients. Washington and London: Pharmaceutical Press and American Pharmacists Association; 2009. p. 1.
- Oppong EE, Kipo SL. Purification, Physicochemical And Formulation Properties of Shea (Vitellaria Paradoxa) Gum. Kwame Nkrumah University of Science & Technology. , Pharmaceutics. Accra: Faculty of Pharmacy and Pharmaceutical Sciences; 2012. p. 108-119.
- Peppas N, Bures P, Leobandung W, Ichikawa H. Hydrogels in pharmaceutical formulations. European Journal of Pharmaceutics and Biopharmaceutics 2000; (50): 27-46.
- Alderborn G. Tablets and compaction. In: Aulton ME, Taylor KM, editors. Aulton’s Pharmaceutics, the design and manufacture of medicines. 3rd Edition. Leicester, UK: Churchill Livingstone Elsevier; 2007. p. 665-669 and 208-210.
- Ohwoavworhua FO, Adeola JI. Extraction and characterization of starch obtained from earth pea. African Journal of Pharmaceutical Reseach and Development 2005: 3-5.
- Moin A, Kumar A, Raizaday A, Gopal M. Development Of Cashew Gum And Its Derivatives For Sustained Released Drug Delivery System: By Response Surface Methodology. International Journal of Pharmacy and Pharmaceutical Sciences 2014; 6(10): 476 – 484.
- British Pharmacopoeia. General Medical Council. Bloomsbury Square London: Pharmaceutical Press -17; 2004.
- Rana V, Rai P, Tiwary A, Singh RS, Kennedy JF, Knill CJ. Modified gums: Approaches and applications in drug delivery. Carbohydrate Polymers 2011; (83): 1031-1047.
- United States Pharmacopeia – National Formulary. USP 40 – NF 35 (Vol. 1). United States of America; (2017).
